[latexpage]
Lines
If we have two defined points within a coordinate system, say point $A({x_{{1}},y_{{1}})}$ and point B(${x_{{2}},y_{{2}})}$ , we are able to draw a line between them. By means of an amazing feat, we are able to determine the slope of this line by finding the “change in” both the x and y coordinates and setting them together in a ratio. The ratio that defines the slope is the rise over the run, or in equation terms:
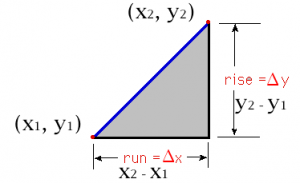 \begin{equation*}
{m(\normalsubformula{\text{slope}})=\frac{\normalsubformula{\text{rise}}}{\normalsubformula{\text{run}}}=\frac{\mathit{\Delta
y}}{\mathit{\Delta x}}=\frac{y_{{2}}-y_{{1}}}{x_{{2}}-x_{{1}}}}
\end{equation*}
With the slope defined, we are beginning to develop the unique equation of the straight line drawn. The fundamental equation for a line is:
\begin{equation*}
{y=\normalsubformula{\text{mx}}+b}
\end{equation*}
The constant b is the y-intercept of the equation, telling us where the line crosses the y axis when x is set to 0.
If we have determined the slope, then we are able to take just one of the defined points to determine what this constant equals using the following equations:
\begin{equation*}
{b=y_{{1}}-\normalsubformula{\text{mx}}_{{1}}}
\end{equation*}
There may be times that you are given just one point on a line, along with the slope, and asked define the equation of the line.
In this case, using the point-slope form of the straight line equation will work miracles for you. The point-slope equation is:
\begin{equation*}
{(y-y_{{1}})=m(x-x_{{1}})}
\end{equation*}
Knowing the slope can tell us a few things about the line without even seeing it drawn.
If m is positive, then we know the line runs diagonally up and to the right.
If on the other hand, m is negative, then the line will be working its way diagonally down as it works its way right.
A large m tells us the line is steep whereas a smaller m tells us that the line is more horizontal.
If m = 0, then the line is horizontal and its equation is simply y = b.
The following relationships can tell us if a pair of lines are either parallel or perpendicular to one another:
Two non vertical lines are perpendicular if there slopes \
are exactly equal ${m_{{1}}=m_{{2}}}$
Two lines defined by slopes ${m_{{1}}}$ and ${m_{{2}}}$ are perpendicular
if and only if ${m_{{1}}=-{\frac{1}{m_{{2}}}}}$
Circles
Recall for a moment that the distance between two given points in the x direction is $\delta x=x_2-x_1$ and in the y direction is $\delta y=y_2-y_1$. These are just one dimensional distances and do not give us the actual distance between the two points. However, knowing $\delta x$ and $\delta y$, we can use the Pythagorean theorem to calculate the actual distance between two points.
The Pythagorean theorem states:
$\sqrt{(\delta x^2)+(\delta y^2)}=h$
Or simply restated, taking two points $|P_1|$ and $|P_2|$, the distance between them is:
$|P_1-P_2|=sqrt{(x_2-x_1)^2+(y_2-y_1)^2}$
We can tweak this distance formula a bit to obtain the equation of a circle.
Say we have a point $(P_1(x,y))$ that is distance R from the origin at (0,0), the distance formula looks a little like this:
$|P_1-P_2|=sqrt{(x_2-0)^2+(y_2-0)^2}$
Which when squaring both sides and simplifying we get the equation of a circle centered at the origin.
$R^2=x^2+y^2$
However, this isn’t a cover all equation for all circles, being that, many times we run in to circles that aren’t centered on the origin. In this case, let’s assume we have a circle that is centered at a point ${(h,k)}$. Plugging this information in to the distance equation while still assuming the distance between the origin and $(P_1(x,y))$ is R, we get after squaring and rearranging:
\begin{equation*}
{(x-h)^{{2}}+(y-k)^{{2}}=R^{{2}}}
\end{equation*}
It is possible to find the equation to a line that is tangent to any point $(x_1,y_1)$ on a given circle using the following equation and given the point on the circle.
\begin{equation*}
{(x_{{1}}-h)(x-h)+(y_{{1}}-k)(y-k)=R^{{2}}}
\end{equation*}
Conics
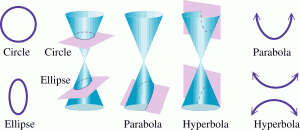
Conic sections are used to describe all the possible ways a plane and a double right cone can intersect. In forming the four basic conics, the plane does not pass through the vertex of the cones. The four basic conics are:
Parabolas
The trajectory of an object strictly subjected to the force of gravity is always an approximation of a parabola.
All parabolas are loosely shaped like the letter “U”. Each has a unique vertex, either high or low, where direction is changed. Depending on how the points approach this vertex, parabolas can open either upward or downward and may or may not have x-intercepts but will always have at least a single y-intercept.
A parabola has an axis of symmetry where to either side of the axis is a mirror image of the opposite. Knowing this, with one given point, we are able to determine the point exactly opposite.
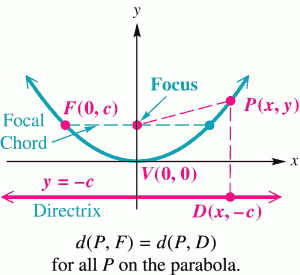
In simple terms, a parabola is just a set of points in a plane equidistant from a fixed point and a fixed line. The fixed point is called the focus, and the fixed line is the directrix. Knowing these values and placing them in to the distance formula, we can derive the equation of a parabola as:
The equation for these points can be determined quite simply by using the distance formula. From the illustration above, the line y = –c is the directrix and focus is the point (0, c). Choosing an arbitrary point P(x, y) on the curve, we can derive the equation of the parabola knowing that the distance from the focus, F, to P, and the point on the directrix, D, to P, must have the same length so that:
\begin{equation*}
{x^{{2}}=4\normalsubformula{\text{cy}}}
\end{equation*}
For a parabola offset from the origin by an arbitrary distance of h and k in the x and y directions, respectively, the equation is:
\begin{equation*}
{(x-h)^{{2}}=4c(y-k)}
\end{equation*}
This equation is useful, but at times may be a little tedious to work with, however, luckily, there are equivalent formulas that can be used to define a parabola, one that we are very familiar with, which is:
\begin{equation*}
{f(x)=\normalsubformula{\text{ax}}^{{2}}+\normalsubformula{\text{bx}}+C}
\end{equation*}
If this looks familiar, it’s because it should. The equation above is the general form of the Quadratic Equation, and when graphed, the output is a parabola.
In this form the sign of $a$ will still tell you whether or not the parabola will open upwards or downwards. However, unlike the previous format, we will not get away with simply viewing the equation to determine the vertex. With the constants defined, use the following equation to define the vertex.
\begin{equation*}
{\left(h,k\right)=\left(-{\frac{b}{2a}},f(-\frac{b}{2a})\right)}
\end{equation*}
We can determine the y-intercept (C) simply by setting the equation to 0:
\begin{equation*}
{f(0)=a(0)^{{2}}+b(0)+C=C}
\end{equation*}
The following relationships are useful when you need options for determining the constants, focus, and directrix:
\begin{equation*}
{a=\frac{1}{4}c}
\end{equation*}
\begin{equation*}
{b=-{\frac{h}{2c}}}
\end{equation*}
\begin{equation*}
{c=k+(\frac{h^{{2}}}{4c})}
\end{equation*}
Ellipses
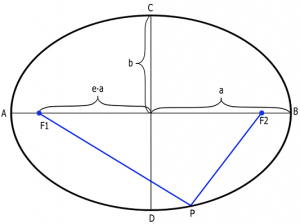
Similar to the parabola, the ellipse is a set of points in a plane where when given any point P, the sum of the distances from P to two fixed points ${F_{{1}}}$ and ${F_{{2}}}$(known as the foci) is constant.
\begin{equation*}
{|\normalsubformula{\text{PF}}_{{1}}|+|\normalsubformula{\text{PF}}_{{2}}|=2a}
\end{equation*}
It’s important to note that the Foci (plural for focus) are located and fixed on the Major Axis of the ellipse, which is the axis that runs from A to B in the illustration above. The length of the major axis is 2a.
The Minor axis, on the other hand, runs from C to D and has a length of 2b. The length variable a and b are known as the semi-major and semi-minor axis.
Eccentricity, with a notation ${e}$, is an important dimensionless quantity that is derived from an ellipse. The term eccentricity is defined as the ratio of the distance between the foci and the length of the major axis. In other words, the distance between the foci is ${\text{2ea}}$ and the distance from a focus (one of the foci) to the center of the ellipse is ${\text{ea}}$.
The eccentricity for an ellipse will always be a positive number less than 1.
Given the parameters a and b, we are able to calculate ${e}$ as follows:
Consider Point P in the illustration above. Using the distance equation, we see that the distance from P to either focus is given by
\begin{equation*}
{|\normalsubformula{\text{PF}}_{{1}}|=|\normalsubformula{\text{PF}}_{{2}}|=\sqrt[{}]{(\normalsubformula{\text{ea}})^{{2}}+b^{{2}}}}
\end{equation*}
Using the equation ${|\normalsubformula{\text{PF}}_{{1}}|+|\normalsubformula{\text{PF}}_{{2}}|=2a}$ from above, we also know that the distance is equal to a, which simplifies the equation to:
\begin{equation*}
{e^{{2}}a^{{2}}+b^{{2}}=a^{{2}}}
\end{equation*}
When rearranged and solved for ${e}$:
\begin{equation*}
{e=\frac{\sqrt{(a^{{2}}-b^{{2}})}}{a}}
\end{equation*}
Given an ellipse centered at the origin with the semi-major axis a on the x axis and the semi minor axis b along the y axis, we can use the following general equation to define it:
\begin{equation*}
{\frac{x^{{2}}}{a^{{2}}}+\frac{y^{{2}}}{b^{{2}}}=1}
\end{equation*}
As is the case with circles, the general formula of an ellipse isn’t a coverall for all situations. Many times we will run in to problems where ellipses are are not centered at the origin, but rather at an arbitrary point ${(\text{h,k})}$. \ Not to fret, simply tweak the general form as above to account for this offset:
\begin{equation*}
{\frac{(x-h)^{{2}}}{a^{{2}}}+\frac{(y-k)^{{2}}}{b^{{2}}}=1}
\end{equation*}
Hyperbolas
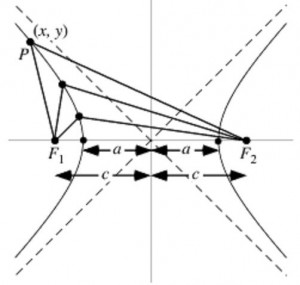
The final conic we will touch on is the hyperbola. Similar to an ellipse, the hyperbola is dependent on two fixed foci, ${F_{{1}}}$ and ${F_{{2}}}$, located in the plane set at a certain distance 2a apart. However, differing from the ellipse, the equation for the hyperbola involves the difference between the two distances $(PF_1)$ and $(PF_2)$, not the absolute values of the distances.
$d(PF_1)-d(PF_2)=2a$
Graphically we get:
All hyperbolas are made up of two curves, one on the left of the axis and one on the right. The line on the left is developed by the values that drive the equation ${d\left(\normalsubformula{\text{PF}}_{{1}}\right)-d\left(\normalsubformula{\text{PF}}_{{2}}\right)}$ to be negative. The line on the right is developed by the values that make the equation positive. These two lines never touch and are completed separate curves.
The eccentricity of a hyperbola can be found in the same manner as it is for an ellipse. The only difference in the equation is the addition sign:
\begin{equation*}
{e=\frac{\sqrt{(a^{{2}}+b^{{2}})}}{a}}
\end{equation*}
The eccentricity for a hyperbola will always be a positive number greater than 1.
Quick side note for eccentricity:
${e}$ for a circle is always 0
${e}$ for an ellipse is always between 0 and 1
${e}$ for a parabola is always 1
${e}$ for a hyperbola is always greater than 1
Asymptotes are another key characteristic of a hyperbola. In the illustration at the beginning of this section, they are the diagonal dotted lines. They are defined as the line:
\begin{equation*}
{y=\pm (\frac{b}{a})x}
\end{equation*}
Graphically, having the ability to graph the asymptotes of a hyperbola eases the process of plotting the hyperbola as a whole.
Similar again to the ellipse, only differing in the minus sign, the general formula of a hyperbola centered on the origin is:
\begin{equation*}
{(\frac{x^{{2}}}{a^{{2}}})-(\frac{y^{{2}}}{b^{{2}}})=1}
\end{equation*}
In closing, all the equations above define a hyperbola with foci along the x axis. It is just as easy to graph one with the foci located along the y axis. All that differs in the position of the variables in the equation:
\begin{equation*}
{(\frac{y^{{2}}}{b^{{2}}})-(\frac{x^{{2}}}{a^{{2}}})=1}
\end{equation*}
Or one with an off center origin:
\begin{equation*}
{\frac{(x-h)^{{2}}}{a^{{2}}}-\frac{(y-k)^{{2}}}{b^{{2}}}=1}
\end{equation*}

